Horizontal Bar Graphs within 20 2-131
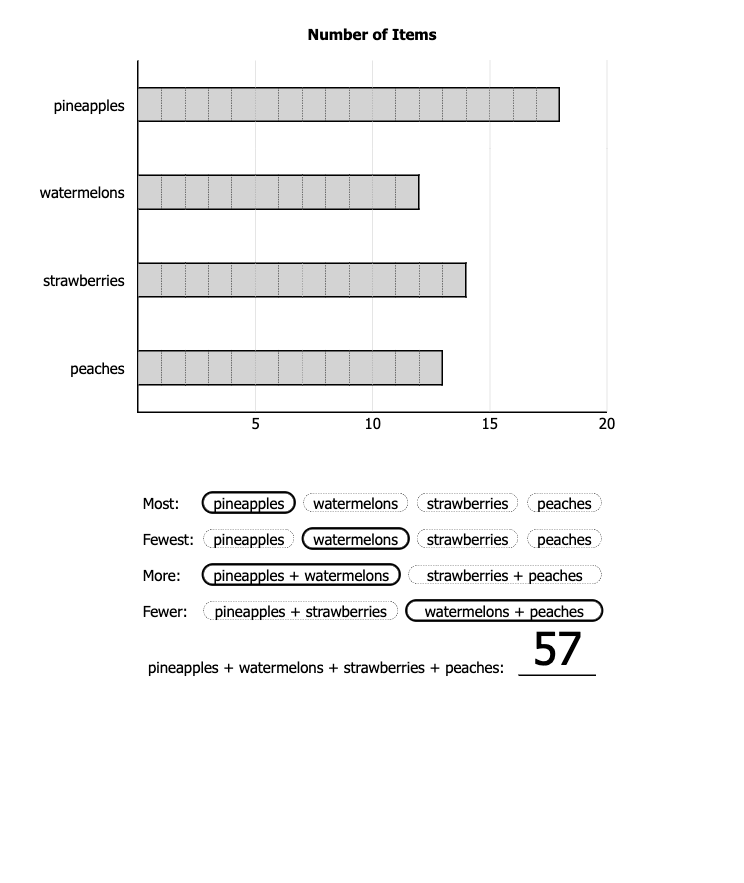
Connect quantity and length by transitioning from picture graphs to bar graphs. Represent 1 object with 1 unit bar. Since there are no gaps or overlaps, the number of objects in each category is represented by the length of each bar and given by the graph's horizontal axis. Compare and calculate sums and differences.