Scaled Bar Graphs 3-122
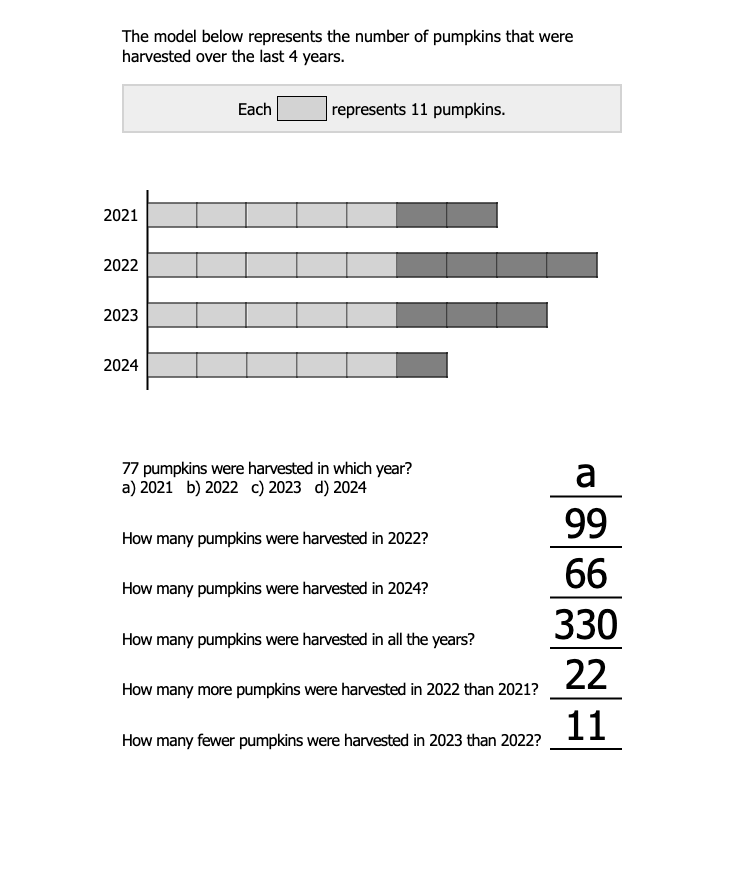
Transition to more flexible, bar graphs. Draw unit bars to represent scaled values. The number of objects in each category is represented by the length of each bar, and calculated by scaling the number of units by the factor in the key. Compare and combine categories to find totals, sums, and differences.