Line Plots with Metric Units 2-133

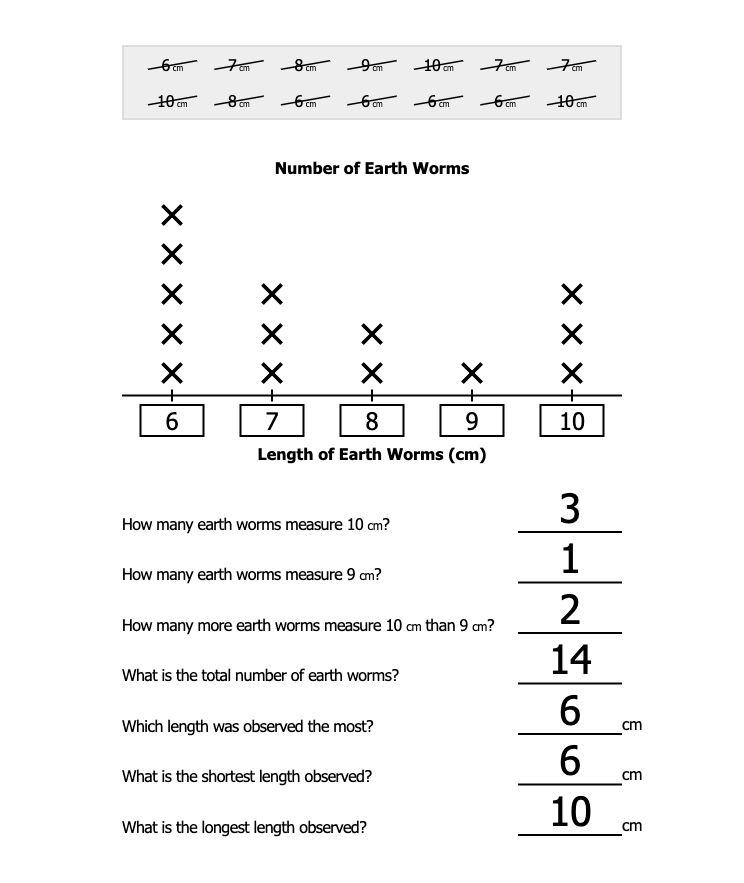
Draw line plots to make sense of data measured in centimeters, meters, grams and kilograms. Start by drawing a number line that includes all the values in the sample. Write the smallest and largest values first, followed by all the numbers in-between. Plot the frequency of each length or weight to better understand the sample's data as a group.


1. Learn

play_circle_outline

Draw line plots to make sense of data measured in centimeters, meters, grams and kilograms. Start by drawing a number line that includes all the values in the sample. Write the smallest and largest values first, followed by all the numbers in-between. Plot the frequency of each length or weight to better understand the sample's data as a group.

star_border

2. Practice

Lesson
2-133
Lesson
2-133
Lesson
2-133
star_border

3. Apply

POD
2-133
POD
2-133
POD
2-133
star_border
Want more? Try Gone Fishin' B!