Make sense of data when the scale of a picture or bar graph is greater than 1. Connect quantity and length by transitioning from picture graphs to bar graphs. Use scaled graphs to master multiplication facts, visuallize data with larger values, and provide context for operations.
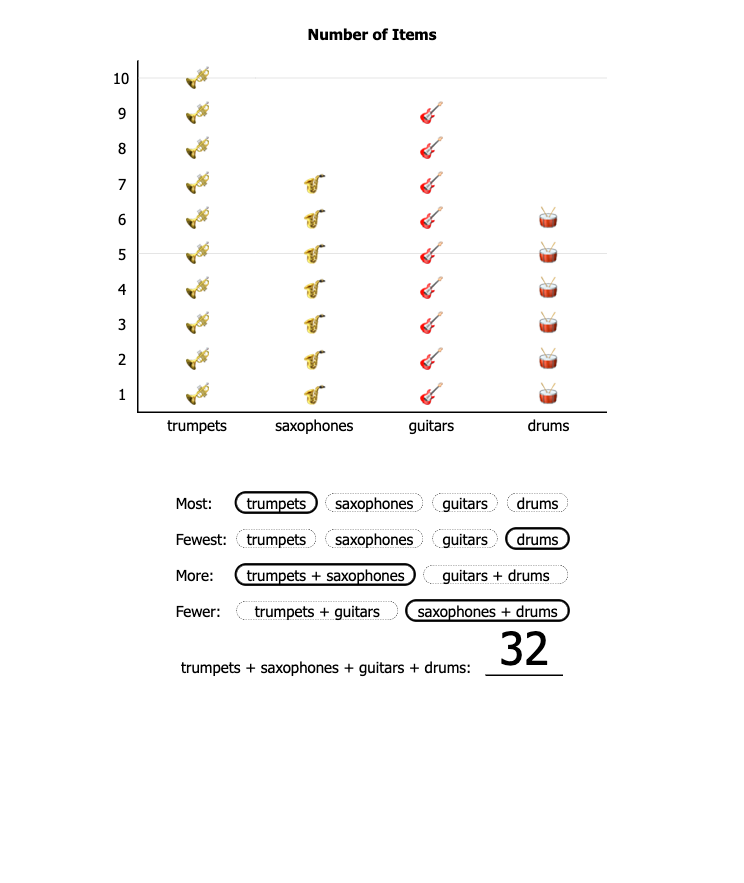
Use vertical picture graphs to make sense of data and provide context for operations. Which category has the greatest number of objects – the most? Which has the least number of objects – the fewest? Find the sum of any 2 categories. Compare and quantify their differences. How many objects in all – the sum of 4 addends? Prerequisites: 1-5
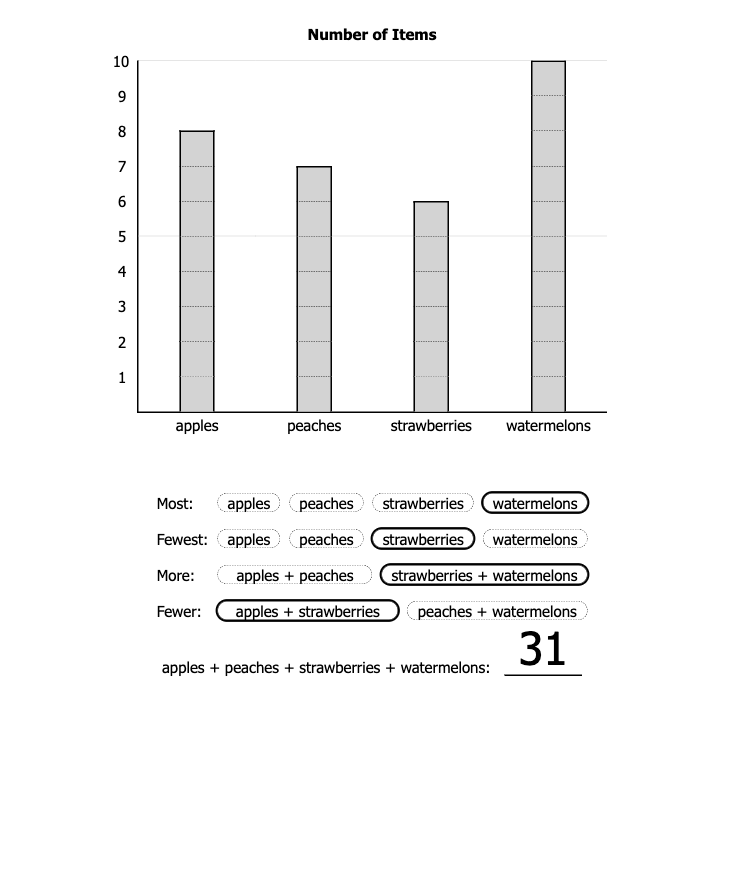
Begin to connect quantity and length by transitioning from picture graphs to bar graphs. Represent 1 object with 1 unit square or unit bar. Since there are no gaps, the number of objects in each category is represented by the length of each bar and given by the graph's vertical axis. Compare and calculate sums and differences. Prerequisites: 2-128
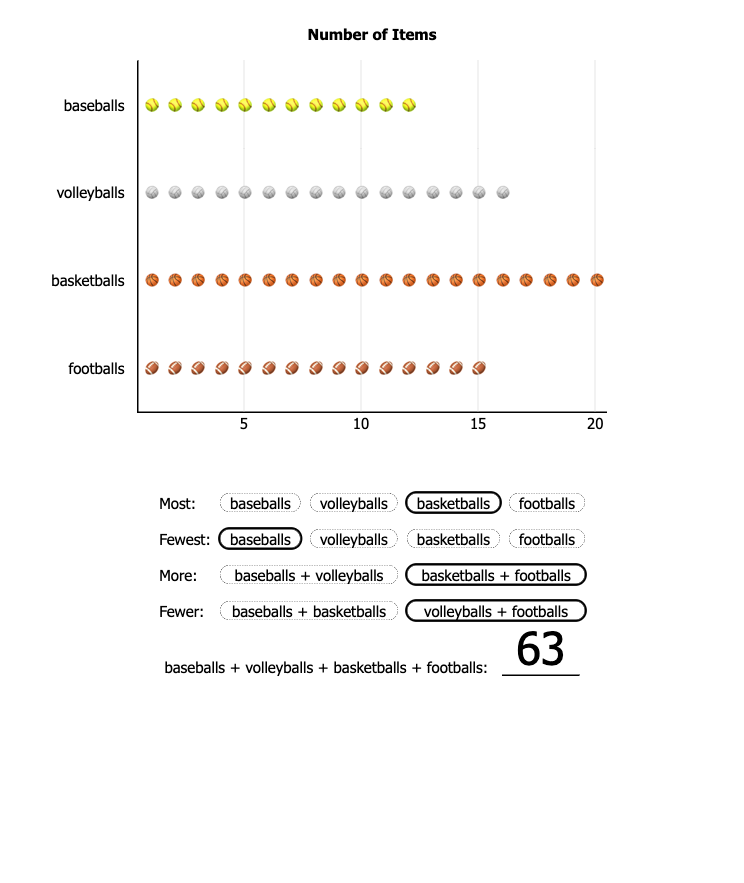
Generalize from vertical to horizontal picture graphs. Use data to provide context for operations, and graphs to represent numbers visually and build number sense. Use grouping strategies based on multiples of 5 and 10 to calculate and compare 1 category, 2 categories, and calculate how many in all. Prerequisites: 2-128 ○ 1-4