Use picture graphs to represent numbers visually and build number sense. Learn strategies to compare rows or columns, count on, and solve problems by grouping in smart ways. Horizontal and vertical picture graphs provide context for addition and subtraction.
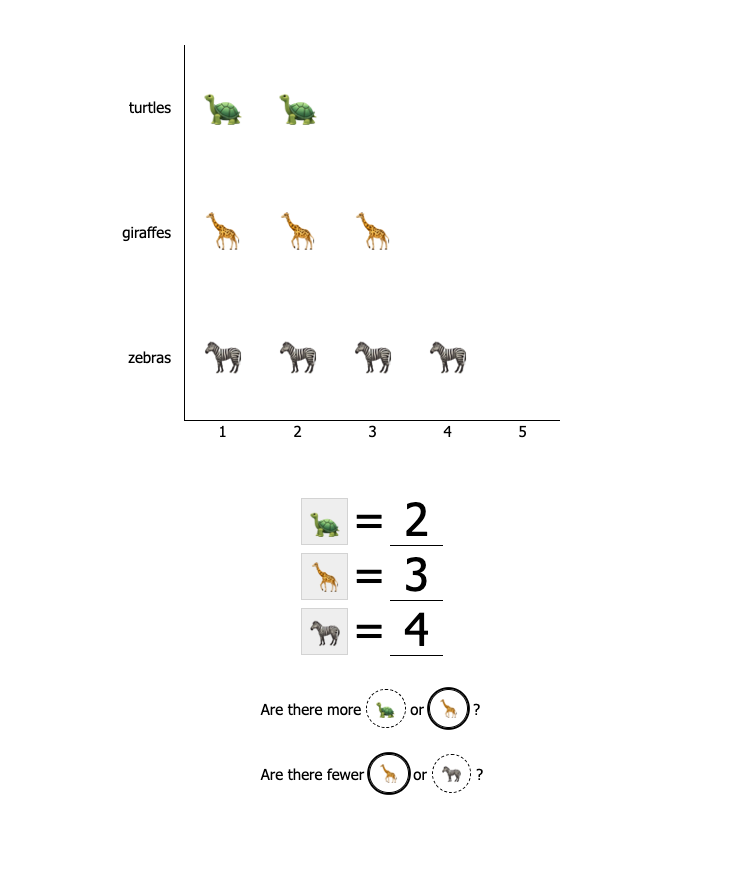
Use picture graphs to represent numbers visually. Find how many in each row by counting. Build number sense by comparing. Is there a pattern? Does the next group or category have the same number of objects, or 1 more? Practice writing digits by tracing. When ready, practice writing digits from memory.
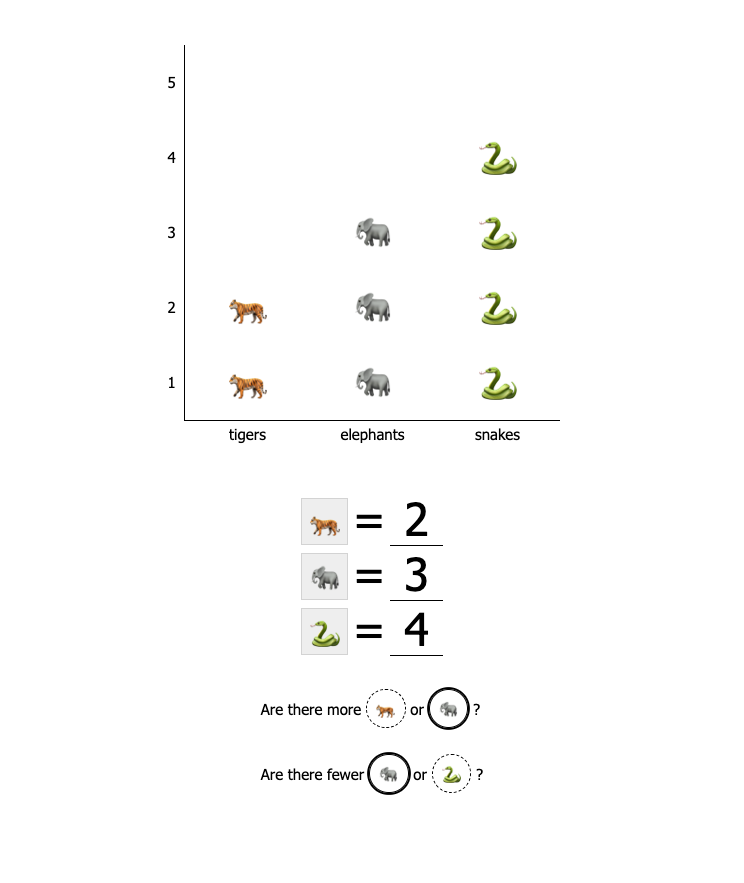
Think flexibly by using vertical picture graphs to model and compare numbers. Find how many in each column by counting. Build number sense by comparing. Is there a pattern? Does the next group or category have the same number of objects, or 1 fewer? Practice writing digits, first by tracing and then from memory. Prerequisites: K-20
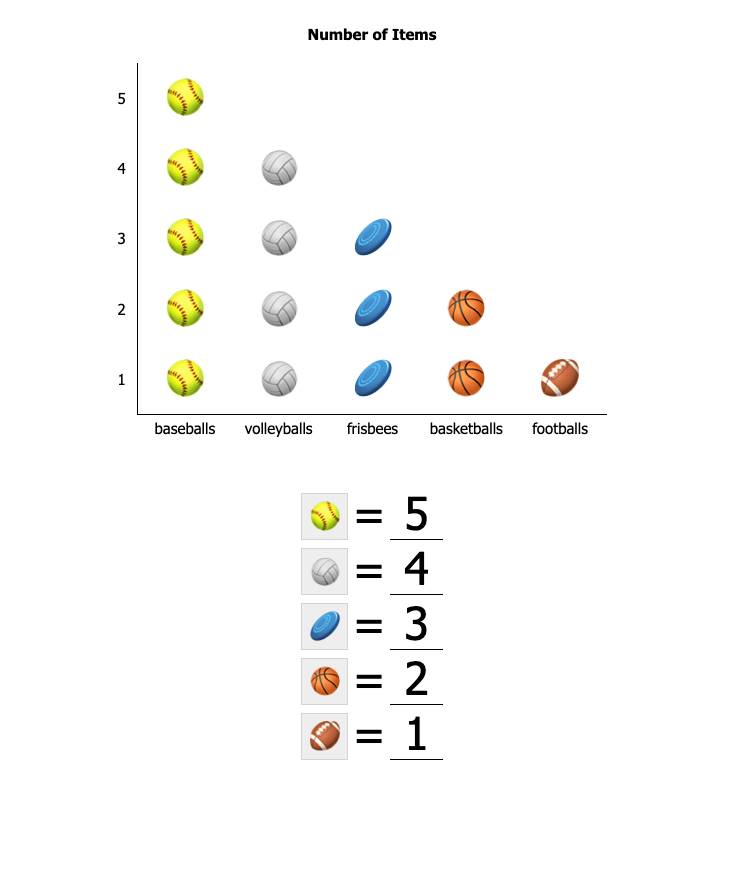
Use picture graphs to count backward and build number sense. Visually compare the number of items in each category to the number of items in the next category. Since it has 1 fewer item, the number is 1 less. Count backward to learn the number that comes before each number – a foundational skill for subtraction. Prerequisites: K-21 ○ K-23