Visualize data by plotting frequency on an open number line. Use line plots to answer statistical questions about the data. Use fractional measurements of data measured to the nearest half and quarter unit, and progress to data measaured to the nearest tenth or hundredth of a unit.
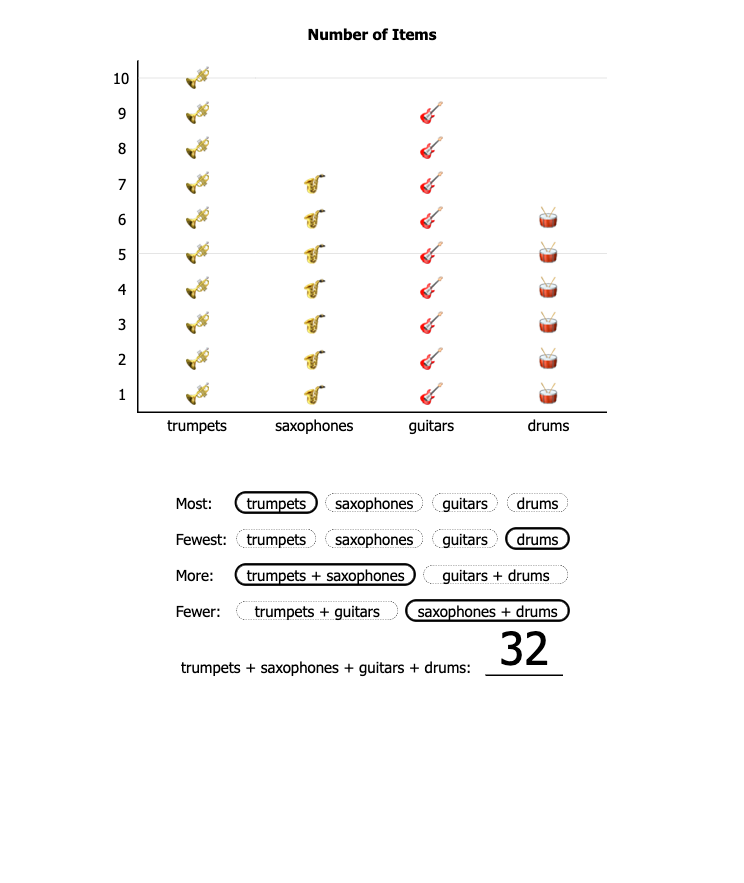
Use vertical picture graphs to make sense of data and provide context for operations. Which category has the greatest number of objects – the most? Which has the least number of objects – the fewest? Find the sum of any 2 categories. Compare and quantify their differences. How many objects in all – the sum of 4 addends? Prerequisites: 1-5
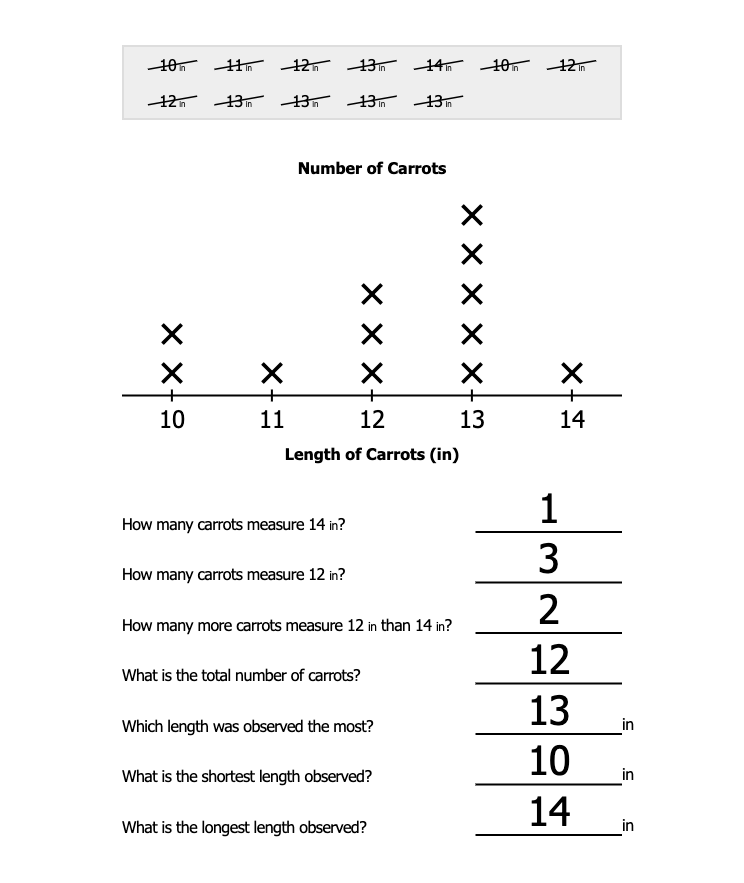
Introduce line plots as a visual way to make sense of data and provide context for measuring length and weight. Plot the frequency of lengths measured to the nearest inch or foot, and the measurement of weight measured to the nearest ounce or pound. What's the minimum length or weight? What's the maximum length or weight? Which length or weight is observed most? Explore data both as individual observations and also as a group. Prerequisites: 2-128
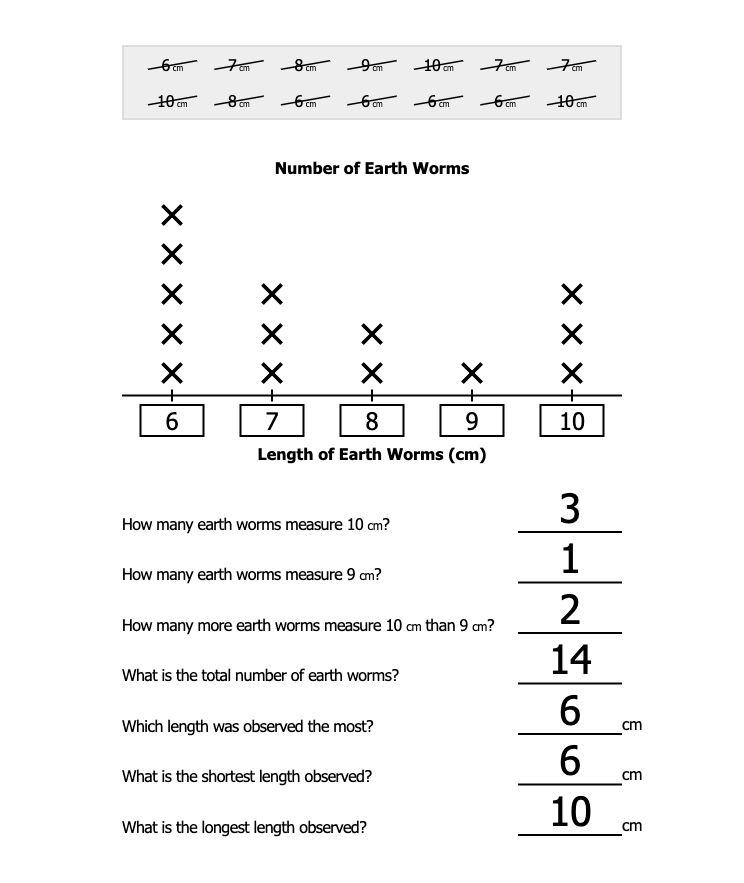
Draw line plots to make sense of data measured in centimeters, meters, grams and kilograms. Start by drawing a number line that includes all the values in the sample. Write the smallest and largest values first, followed by all the numbers in-between. Plot the frequency of each length or weight to better understand the sample's data as a group. Prerequisites: 2-132